Fanshawe Dam and Reservoir
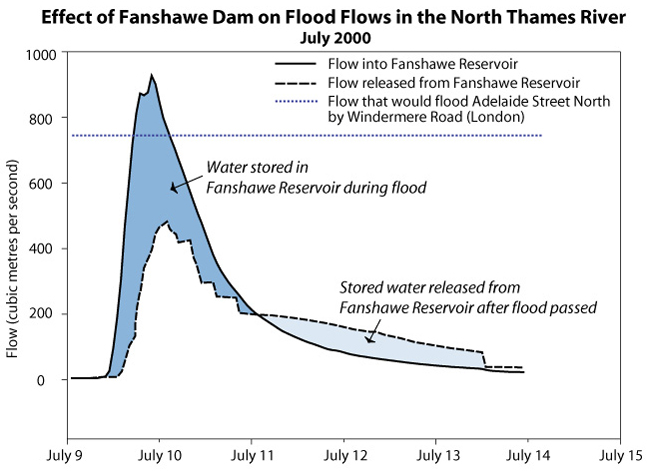
The primary purpose of Fanshawe Dam and Reservoir is to assist in flood control efforts to reduce flood damage in the City of London. Throughout most of the year, the amount of water released from the reservoir is the same as the amount of water entering from upstream. During a flood, less water is released than comes into the reservoir, which results in the reservoir gradually filling up as the extra water is stored. After the flood passes, the stored water is gradually released. Although some flooding may still occur, the flood peaks (the highest flood levels) downstream may be reduced by up to 40% (see graph below).
Hydrology staff use information from several sources to operate Fanshawe Dam and to integrate operations of the three dams on the Thames. Computer models of floods, operating tables, weather data and water level information from above and below the dam enable staff to assess and respond to flood potential and initiate the municipalities’ flood warning systems, if necessary.
Many factors affect the severity of flooding, such as snow pack (depth and water content), soil conditions (may be frozen or saturated), temperature (affects snow melt, evaporation and soil moisture) and plant cover (may intercept rainfall). The amount of rain and where it falls is also important. Although London may not receive much precipitation, snowmelt or rainfall in the northern part of the watershed could cause flooding in the city.
Dam Statistics
- Constructed: 1950 – 1952
- Cost: $5 million (structure and land)
- Who paid: Federal government 37.5%, Provincial government 37.5%, UTRCA 25% (95% City of London, 5% London Township)
- Drainage area: 1,450 square km
- UTRCA property around reservoir: 7.3 square km
Reservoir
Normal (non-flood) Operating Conditions
- Length – 6.4 kilometres
- Maximum width – 0.8 km
- Maximum depth – 12.5 metres
- Surface area – 2.61 square km
- Storage – 12 billion litres
- Surface elevation – 262.1 metres above sea level (masl)
- Drop in elevation to river surface – 12.1 m
Maximum Possible Flood Conditions (projected maximum levels that have not been reached in a flood)
- Length – 12 km
- Width – 1.4 km
- Depth – 21.6 m
- Surface area – 6.5 sq km
- Storage – 48 billion L
- Highest possible surface elevation – 271.3 metres above sea level (masl)
- Highest recorded surface elevation – 270.7 masl (March 1977)
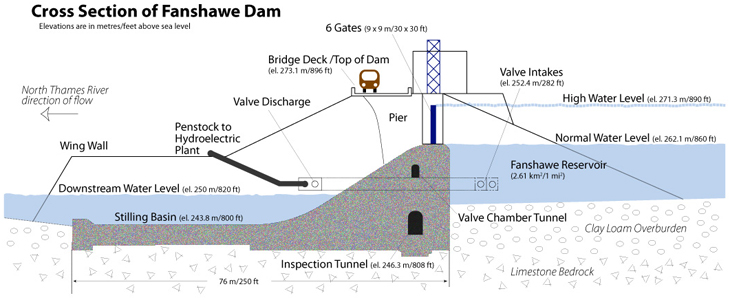
Dam and Berm
- Length of crest – 625 m
- Distance from crest to river bed – 23.5 m
- Distance from crest to bedrock – 30.5 m
- Bridge deck elevation – 273.1 metres above sea level (masl)
- Inspection tunnel elevation – 246.3 masl
- Size of sluice gates (6) – 9.1 m2, 33.6 tonnes
- Maximum total discharge capacity – 3,200 cubic metres/second (cms)*
- Typical summer discharge – 4 cms
- Maximum recorded discharge – 654 cms (March 1963)
* 1 cubic metre = 2 bathtubs; 100 cubic metres = in-ground pool
Did you know that . . .
- 775,023 bags of Portland cement were used in construction of the dam
- When the dam was constructed, the City of London planned to take its water supply from the reservoir
- A stairway with 139 steps descends 30 stories to an inspection tunnel deep inside the dam
- The dam is built on and keyed into bedrock
- Fanshawe Dam has reduced damages resulting from significant floods at least a dozen time in the past five decades
- Although historically most of the severe floods on the Thames River system occurred during the spring snow melt, the most severe floods ever recorded (1883, 1937, 1977) occurred in the late spring or fall and were caused by extremely heavy or prolonged rainfall
- The hydroelectric plant at the base of Fanshawe Dam generates enough power to run 300 households
Safety Near Dams (MNRF webpage)