Explore the Watershed Report Cards in an Interactive Map and StoryMap

There are two new and exciting ways to explore the 2022 Upper Thames River Watershed Report Cards.
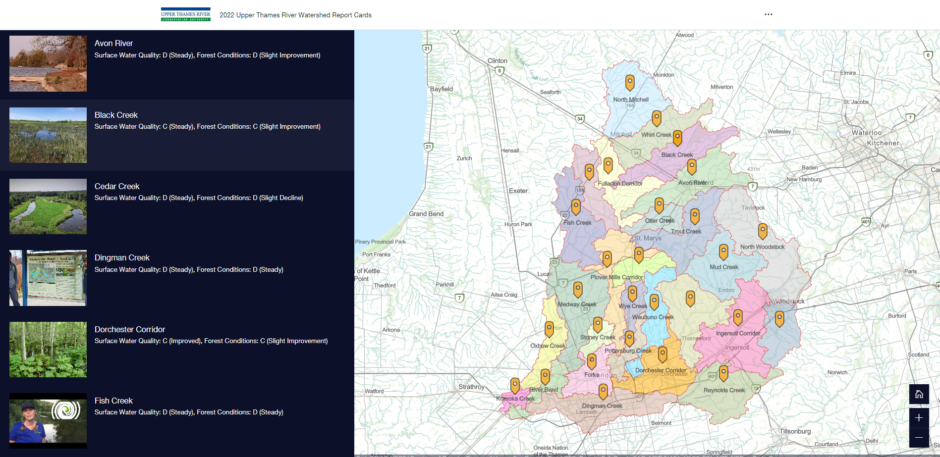
The Upper Thames River Conservation Authority (UTRCA) produces report cards every five years to report on the environmental conditions in each of the 28 watersheds in the Upper Thames River watershed with a focus on surface water quality and forest conditions. Now, you can use your desktop or mobile web browser to interact and tour the watersheds using an Interactive Map and Story Map!
The Interactive Map allows users to navigate through UTRCA’s watersheds using data visualization. Users can select a watershed to highlight it on the map, interact with bar graphs to visualize report card grades using geographic information, and easily access the report card from your own watershed.
Check out the Interactive Map.
The Story Map will take users through a visual experience, exploring report card grades, watershed highlights, and multimedia content for each of the watersheds. Users can scroll through the entire watershed story at their own pace or select watersheds of interest to explore further.

Check out the StoryMap.
Both of these interactive applications are user-friendly and provide a unique way to learn about the status of our local watersheds. Follow the links in this article or go to the watershed report card page on our website to see for yourself. Happy exploring!
Contact: Craig Irwin, Water Quality Specialist